Skip to content
Money Vikings – Truewealth

Money Vikings – Truewealth

Conquer Financial Freedom and True Wealth!

  • YouTube
  • Investing
  • Budgeting
  • Building Wealth
  • Health
  • About
    • Why Upgrade To Premium? Who Are We?
    • Subscribe Now! To Our $10/month Premium Plan
    • Finance Blogs To Follow
    • Affiliates/Books
    • Terms of Service
    • Privacy Policy
1 sign of greed

1 Sign of Greed in the Market

Posted on February 1, 2023February 5, 2023 By Jerry 1 Comment on 1 Sign of Greed in the Market
Investing, Options
  • Market Momentum, as measured by the S&P 500 and it’s 125-day moving average
  • Stock Price Strength as measured by net 52 week highs and lows on the NYSE
  • Stock Price Breadth as measured by the McClellan Volume Summation Index
  • Puts and Calls from Options Traders, as measured by the 5-day average put/call ratio
  • Market Volatility – Let’s not forget the CBOE Volatility Index VIX after all!
  • Safe Haven Demand measured by the difference in 20-day stock and bond returns
  • Junk Bond Demand as measured by the yield spread between junk bonds and investment grade bonds.

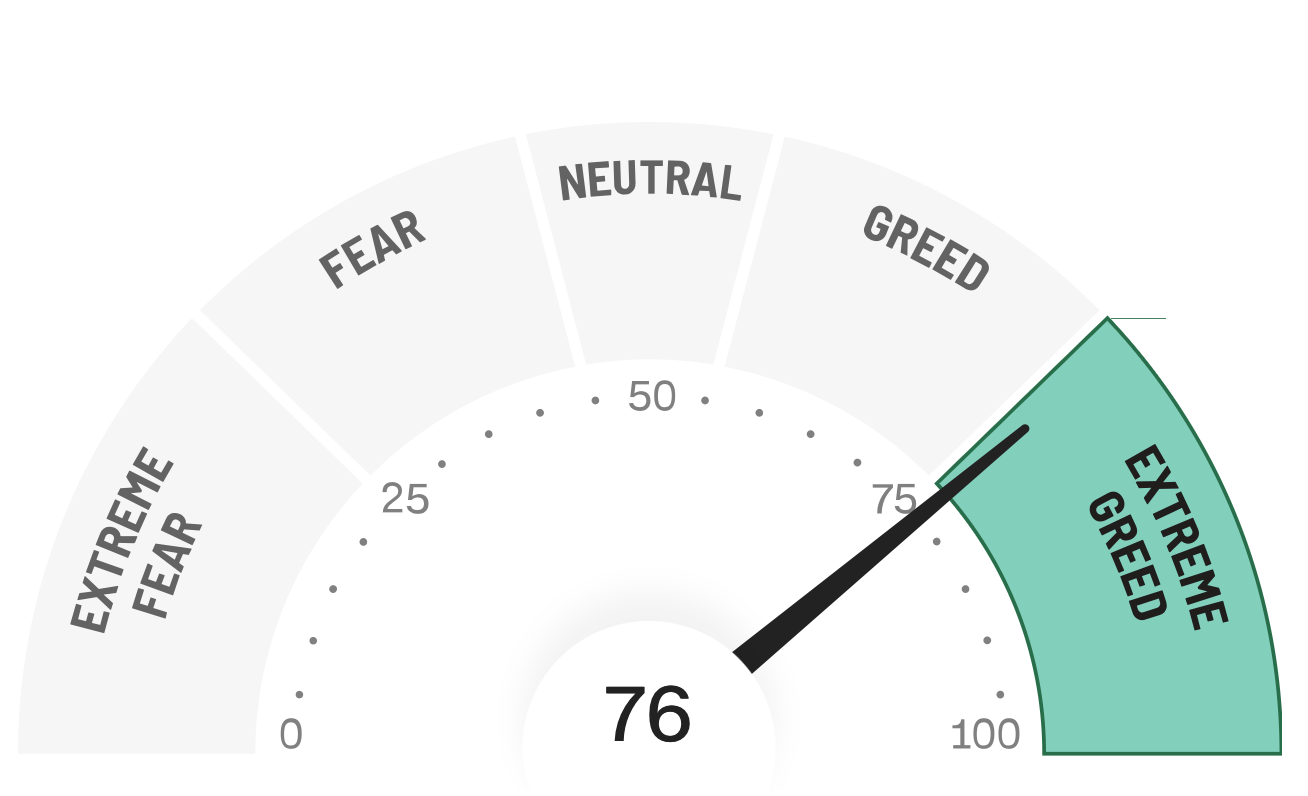
There is 1 sign of greed in the market. Today we are at Greed. Tomorrow will hit Extreme Greed? These charts at first seem very silly. You may wonder if they come from some completely sill reader’s poll that is biased in some way. Actually no, it’s made up of a combination of these metrics

Market Momentum, as measured by the S&P 500 and it’s 125-day moving average

If the index is above the 125 day, it’s deemed bullish so greed prevails.

Stock Price Strength as measured by net 52 week highs and lows on the NYSE

Measures how many net new stocks are at their 52 week highs or lows. When there are more net new highs than lows, it’s deemed bullish.

Stock Price Breadth as measured by the McClellan Volume Summation Index

Number of overall stocks that are rising or falling. More rising is bullish and that signals greed.

Puts and Calls from Options Traders, as measured by the 5-day average put/call ratio

When options traders (generally buyers in this context) buy more calls than puts, that’s bullish, but when they buy more puts than calls, this is thought of as bearish, as more folks are buying “insurance” to hedge a fall in the market.

Market Volatility – Let’s not forget the CBOE Volatility Index VIX after all!

The VIX is an index that it’s tradable and usually spikes when there is a huge drop, and drops quickly when the bulls get control.

Safe Haven Demand measured by the difference in 20-day stock and bond returns

Junk Bond Demand as measured by the yield spread between junk bonds and investment grade bonds.

Here is another article we wrote, not so much about fear and greed, but about how to automated your investing to build wealth, by “robots”, for us.
http://198.199.80.40/2023/01/build-a-robot-wealth-building-army/


Tags: investing options QQQ spy Stock market vix

Post navigation

❮ Previous Post: FAANG NFLX Options Trade Broken Wing 🦋 Butterfly
Next Post: Star Wars Collectibles ❯

Leave a Reply

Your email address will not be published. Required fields are marked *

Search Our Articles

Track all markets on TradingView
Sign up for our Free Newsletter

Tag Cloud

401K 2023 bitcoin Bonds cash back ChatGPT collectibles Compound Interest contrarian covered call crm Dividends earnings finance financial freedom FIRE futures health heatmap home ownership hottrades investing investment iron condor Johnson & Johnson O options Personal Finance QQQ rates real estate investing Real estate investment trusts Realty Income REIT REITs salesforce saving spiderman spy Stock stocks technology trading vix Wealth

Better Uptime Website Monitoring


Copyright © 2025 The Money Vikings – Truewealth.

Theme: Oceanly by ScriptsTown